Where can people browse China and B&R countries' economic data to unlock potential business or investment opportunities when the COVID-19 pandemic is severely denting global economy?
Here Economic Data of Xinhua Silk Road Database may be a pleasant answer.
Economic Data is a statistical sub-database of Xinhua Silk Road Database, a BRI-centered database covering B&R-related news wire service, E-magazines, reports, data, etc. and serves well as a toolkit for institutions to obtain thorough knowledge about China and B&R economies.
Picture I: The login page of Xinhua Silk Road Database
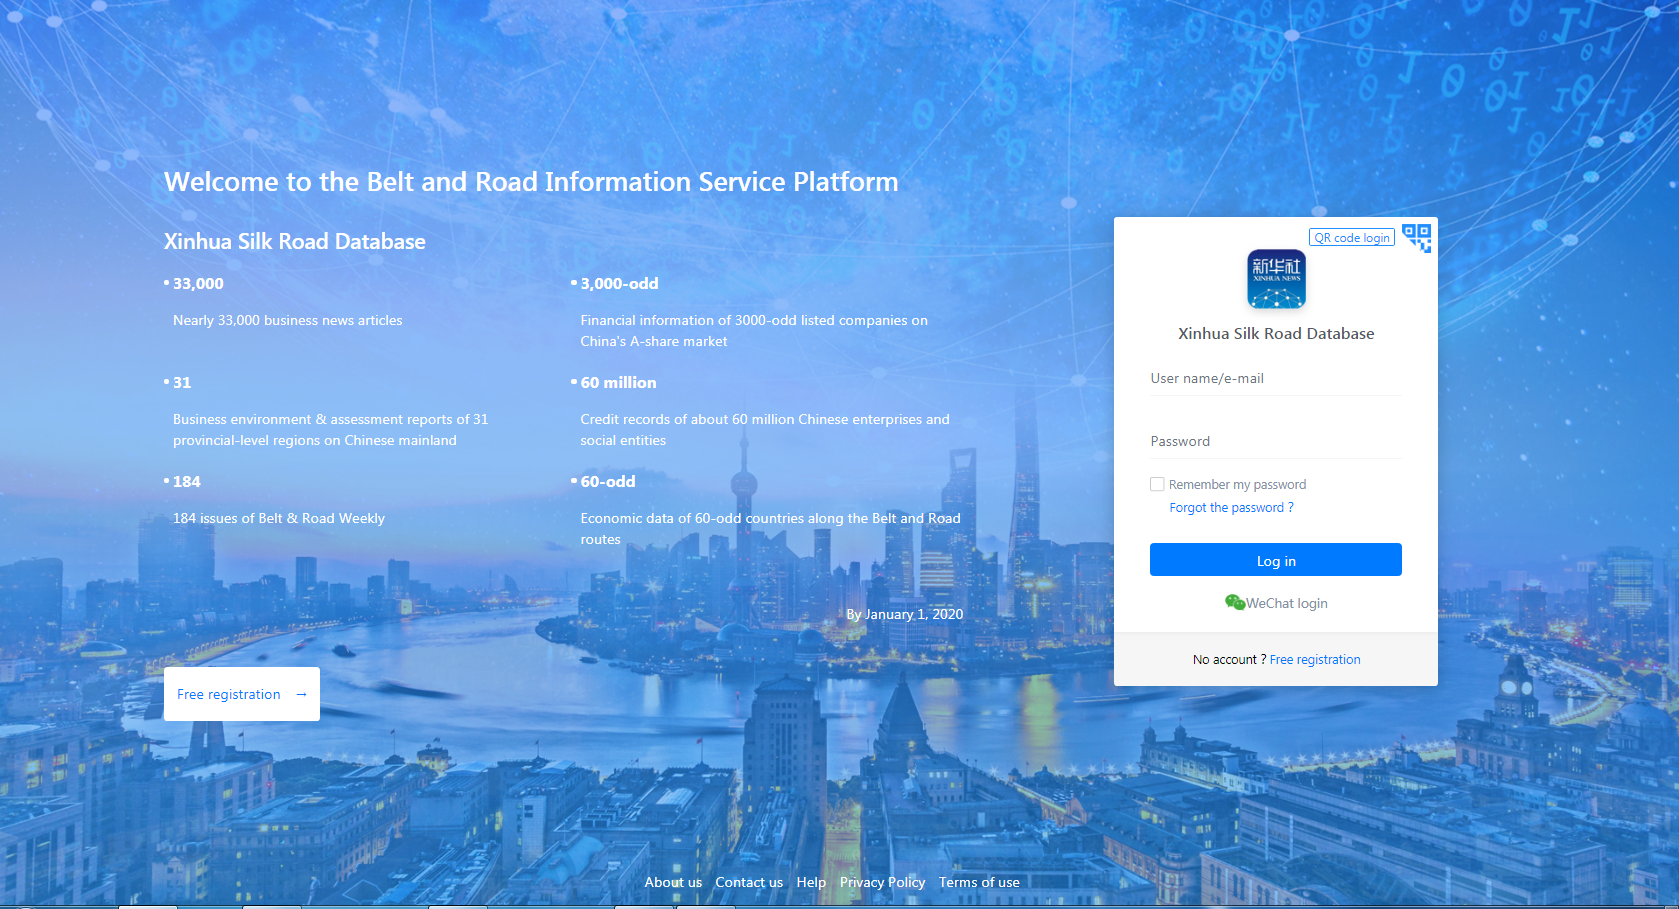
(https://en.imsilkroad.com/login)
In the Economic Data sub-database, users can find such segments as macro data, industry data, etc., among which the macro data section boasts advantages in the following aspects:
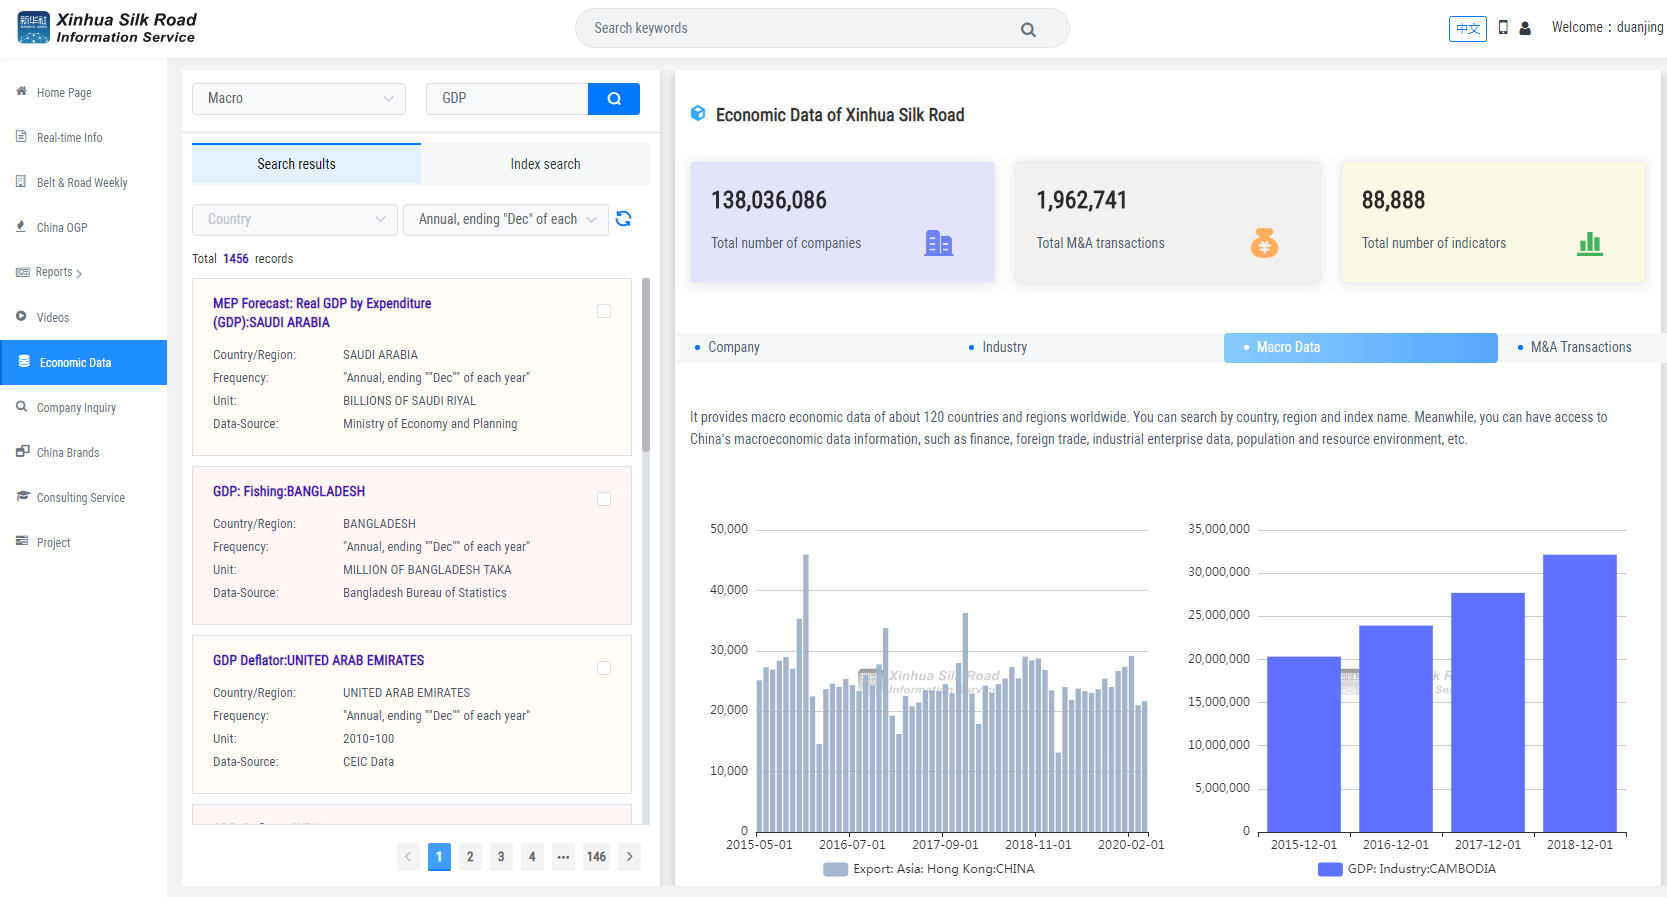
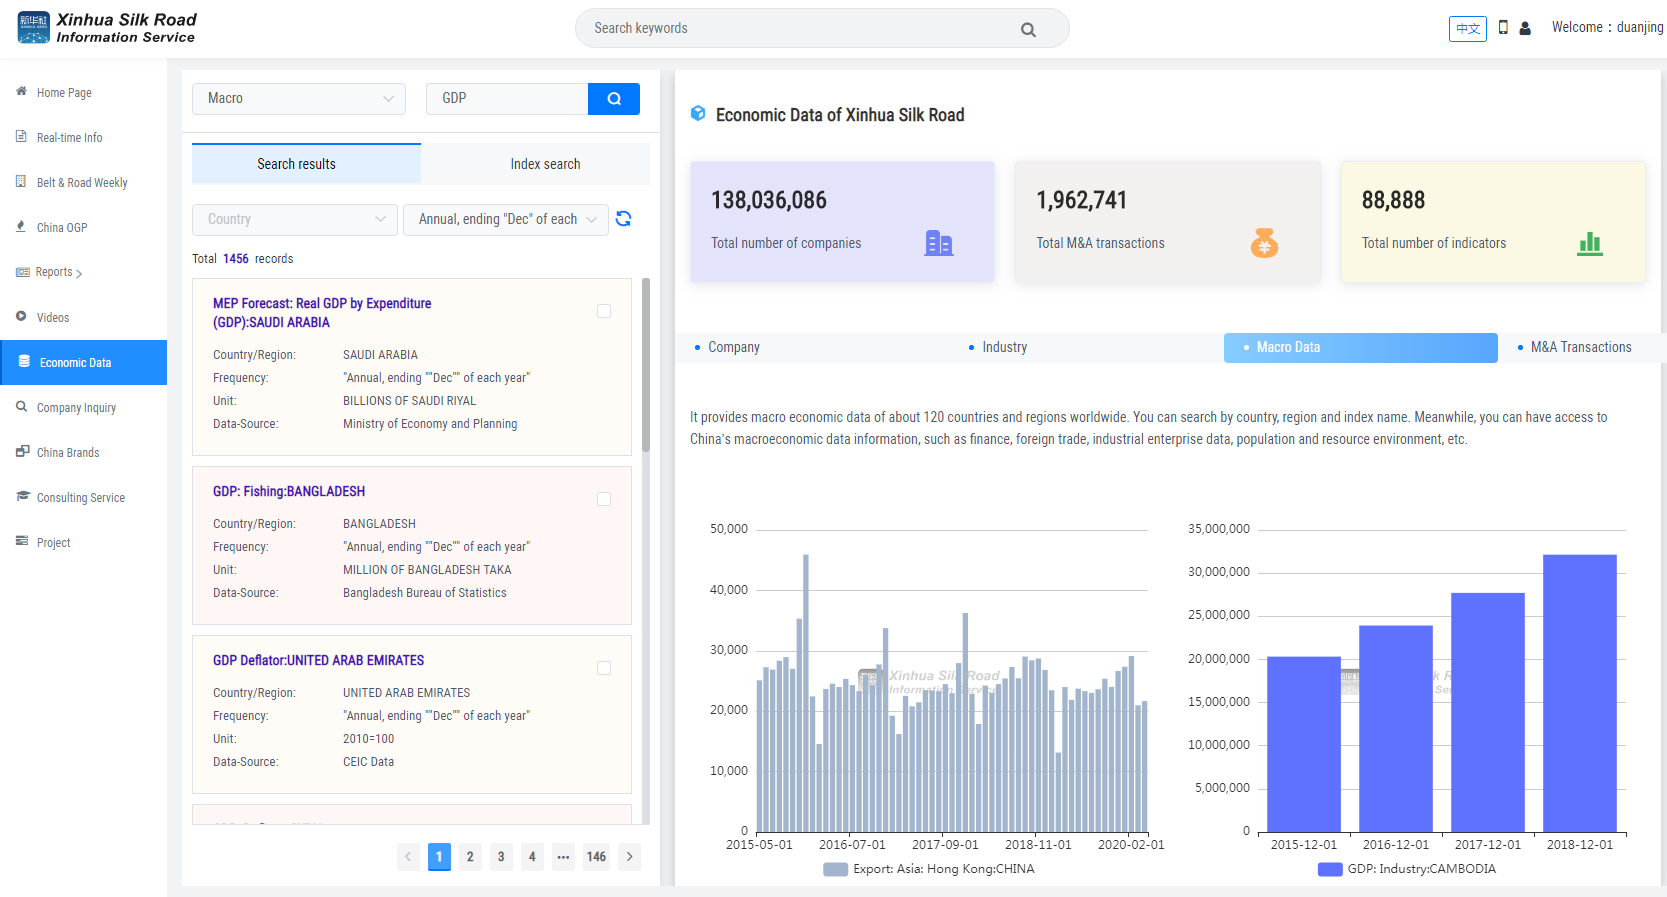
Picture II: Economic Data sub-database of Xinhua Silk Road
Wide Country Coverage
Macro data section of Economic Data sub-database contains economic indicators of as many as around 120 countries and regions in Asia, Europe, North America, South America, Africa and Oceania.
Professional Data Classification
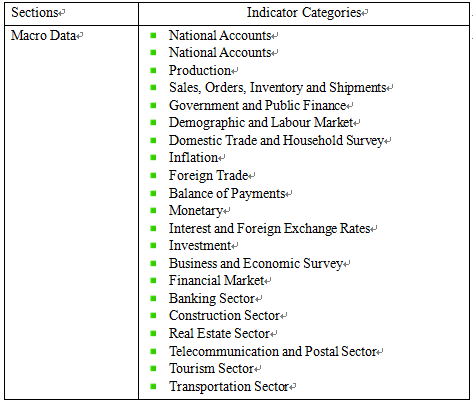
For a country, indicators of 20 categories are provided for users to probe into its economy.
Chart I: Indicator Categories of macro data section
Profound Data Depth
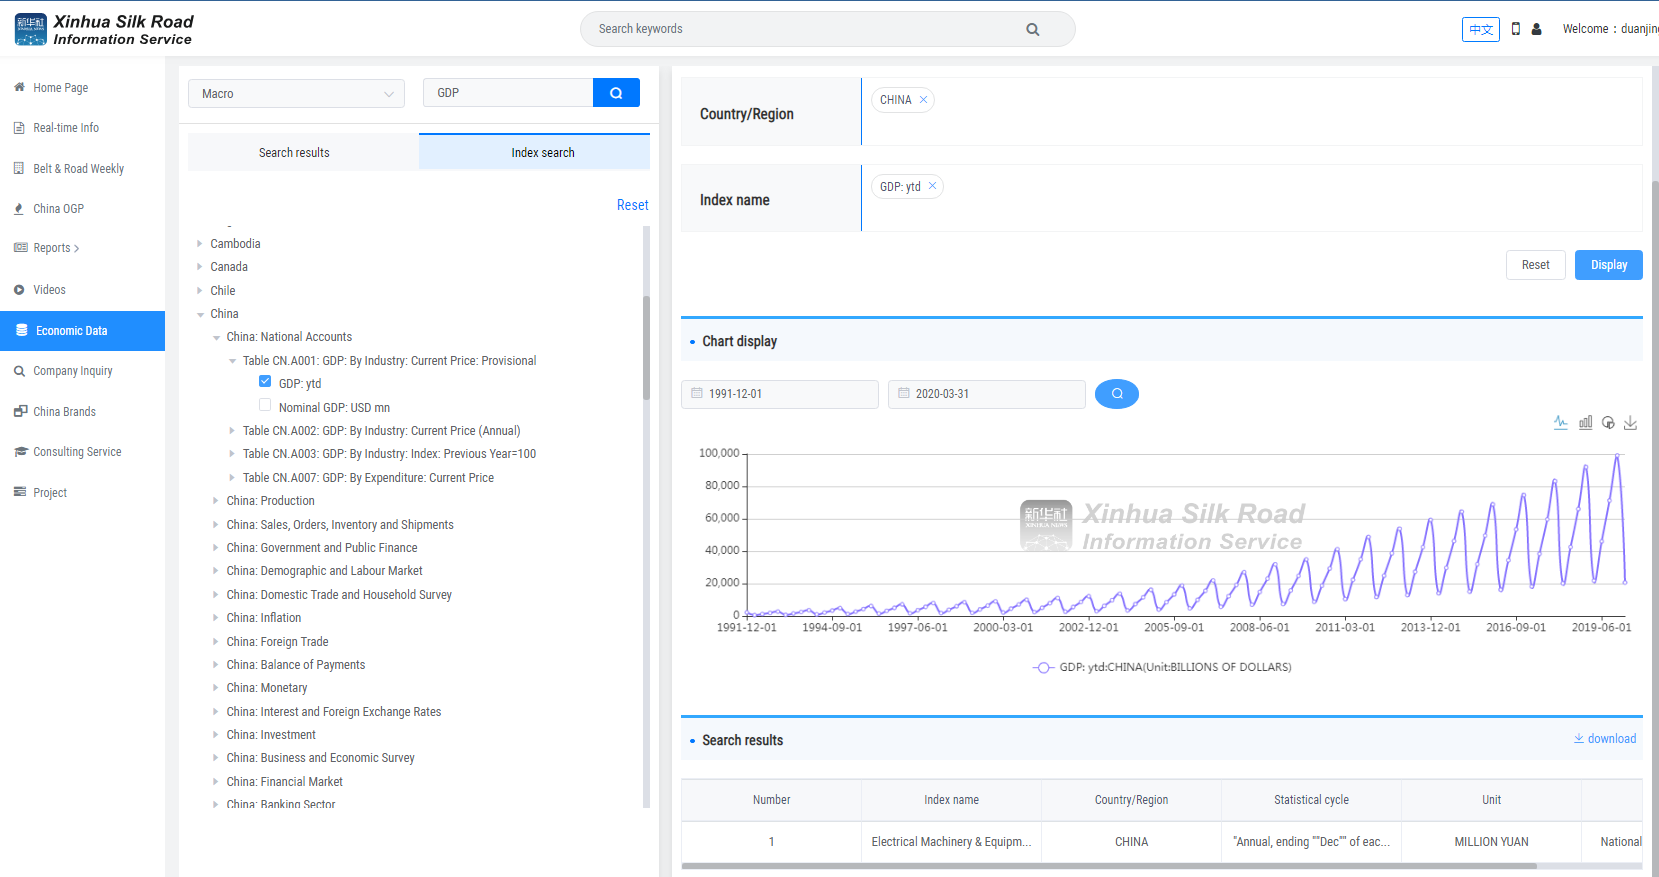
In the macro data section, users can search for data of different categories with a time span from as early as 1991 to 2020 to consolidate their research.
Picture III: China GDP data during 1991 to 2020
Different Ways of Using
-- Searching by economic indicators
For instance, a user desirable to study about the Chinese economy can log into the Xinhua Silk Road Database, click the Economic Data label, select the macro data section and search by concrete macro-economic indicators of China such as GDP, export, or FDI to support his research and avoid potential risks.
-- Index trees
A different way of data inquiry also available to users is the index search, referring to selecting one or more sub-indicators totaling 188 of 12 categories in the macro data section to get access to concrete data.
Visualized Data
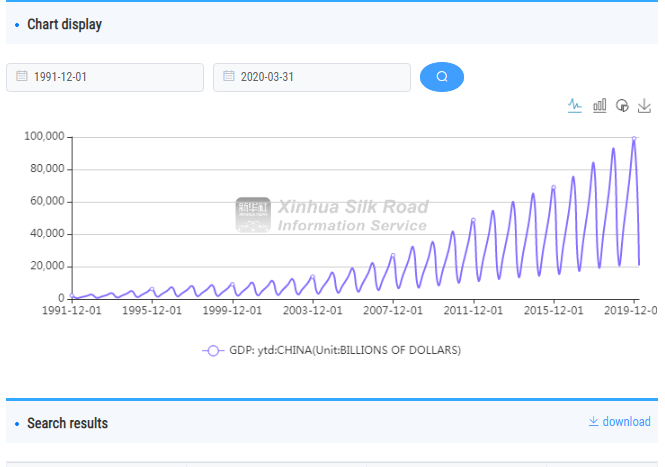
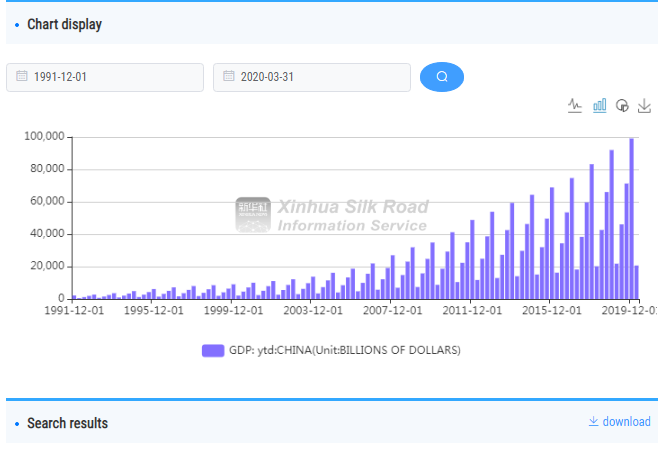
For a single indicator, different ways of data presentation can be selected by users including data visualized as line chart, bar chart or pie chart.
Picture IV: China GDP data showed in a line chart
Picture V: China GDP data showed in a bar chart
For any types of data, users can download them to an excel document.
Xinhua Silk Road Database belongs to Xinhua Silk Road department of Xinhua-run China Economic Information Service (CEIS). For free trial, please search for Xinhua Silk Road and apply for free registration at https://en.imsilkroad.com/register.
For more information about Xinhua Silk Road's products and services, please contact us.
Tel: 86-10-63077787/63073951
E-mail: silkroadweekly@xinhua.org
(Contributed by Duan Jing with Xinhua Silk Road, duanjing@xinhua.org)


 A single purchase


