


Sitting in the north of Jakarta city, the famous pepper export - port of Jakarta is among the busiest across Indonesia.
As the capital of Indonesia, Jakarta is the political, economic and cultural center of the country, and a traffic hub for land, sea, and air. It is also the largest city and a major shipping center in Southeast Asia. Main industries here include shipbuilding, auto assembly, machinery, building materials, textile, tire, chemical fertilizer, food processing, and chemical engineering.
Indonesia has a population of more than 248 million people, ranking fourth in the world. It is a founding member of the Association of Southeast Asian Nations (ASEAN), as well as the largest economy in Southeast Asia and a member state of G20. Indonesia is endowed with raw materials like oil, natural gas, rubber, and wood, laying a solid foundation for its rise. Currently, Indonesia has certain competitive edge in aerospace, information engineering, new energy utilization, agriculture, and biotech. In recent years, Indonesia has maintained stable economic growth and frequent people-to-people exchanges, according to reports by Indonesian media. The country is witnessing skyrocketing rise in the demand for inter-island transportation of coal, oil and gas, natural resources, and finished industrial products. In addition, it also has huge potential in inland shipping industry.
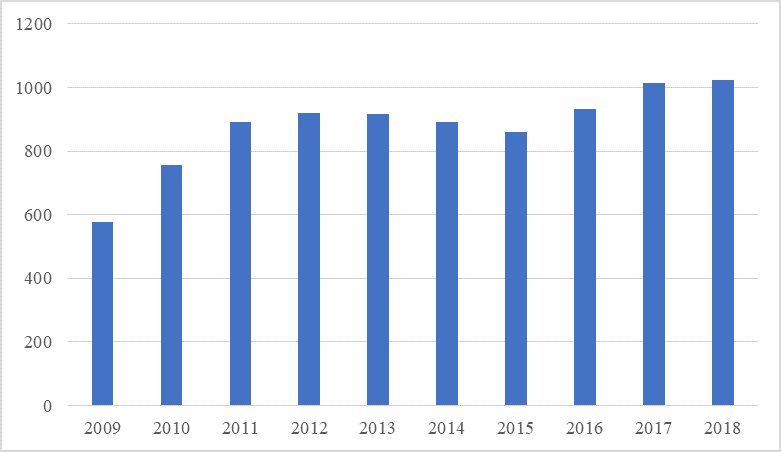
Fig.1 Indonesia's GDP (2009-2018) (Unit: 1 billion U.S. dollars/ USD1 bln)
Source: World Bank
According to Statistics Indonesia, in 2018, Indonesia registered 368.13 billion U.S. dollars of total goods import and export, a year-on-year increase (the same below) of 13.4 percent. Among them, the export value was 180.22 billion U. S. dollars, up 7.5 percent, and the import value was 187.92 billion U.S. dollars, up 19.7 percent. The trade deficit was 7.7 billion U.S. dollars.
Table 1 Indonesia's volume of export to major trading partners in 2018
Countries and regions | Amount (USD1 mln) | Year-on-year growth (percent) | Proportion (percent) |
China | 27,127 | 18.9 | 15.1 |
Japan | 19,480 | 11.4 | 10.8 |
United States | 18,427 | 3.6 | 10.2 |
India | 13,726 | -1.0 | 7.6 |
Singapore | 12,992 | 1.8 | 7.2 |
ROK | 9,533 | 17.9 | 5.3 |
Malaysia | 9,437 | 11.6 | 5.2 |
Philippines | 6,825 | 7.0 | 3.8 |
Thailand | 6,819 | 5.5 | 3.8 |
Taiwan, China | 4,701 | 11.5 | 2.6 |
Vietnam | 4,584 | 27.8 | 2.5 |
Netherlands | 3,898 | -3.5 | 2.2 |
Australia | 2,800 | 12.3 | 1.6 |
Germany | 2,710 | 1.5 | 1.5 |
Hong Kong, China | 2,559 | 6.7 | 1.4 |
Source: Ministry of Commerce of the People's Republic of China
Table 2 Indonesia's imports from major trading partners in 2018
Countries and regions | Amount (USD1 mln) | Year-on-year growth (percent) | Proportion (percent) |
China | 45,349 | 26.8 | 24.1 |
Singapore | 21,385 | 26.6 | 11.4 |
Japan | 17,878 | 17.3 | 9.5 |
Thailand | 10,878 | 17.2 | 5.8 |
United States | 10,148 | 24.9 | 5.4 |
ROK | 9,042 | 11.3 | 4.8 |
Malaysia | 8,563 | -2.7 | 4.6 |
Australia | 5,819 | -3.2 | 3.1 |
India | 5,003 | 23.6 | 2.7 |
Saudi Arabia | 4,909 | 55.0 | 2.6 |
Germany | 3,960 | 11.9 | 2.1 |
Vietnam | 3,787 | 17.3 | 2.0 |
Taiwan, China | 3,544 | 8.9 | 1.9 |
Hong Kong, China | 2,620 | 42.6 | 1.4 |
Nigeria | 2,527 | 96.0 | 1.4 |
Source: Ministry of Commerce of the People's Republic of China
China, Japan and the U.S. are the top three trading partners of Indonesia. In 2018, Indonesia's exports to these countries were 27.13 billion U.S. dollars, 19.48 billion U.S. dollars, and 18.43 billion U.S. dollars, up 18.9 percent, 11.4 percent, and 3.6 percent, respectively. Exports to the three countries altogether accounted for 36.1 percent of Indonesia's total exports. The goods imports of Indonesia from the three countries reached 45.35 billion U.S. dollars, 17.88 billion U.S. dollars, and 10.15 billion U.S. dollars, up 26.8 percent, 17.3 percent, and 24.9 percent, respectively. Imports from these countries altogether accounted for 39 percent of Indonesia's total imports.
India is the largest source of trade surplus for Indonesia. In 2018, Indonesia's trade surplus with India was 8.72 billion U.S. dollars, down 11.2 percent. Besides, its trade surplus with the U.S. was 8.28 billion U.S. dollars in 2018, down 14.3 percent. Indonesia's major sources of trade deficit are China, Singapore, and Thailand. In 2018, its trade deficit with Singapore and Thailand was 8.39 billion U.S. dollars and 4.06 billion U.S. dollars, respectively.
In terms of commodities, mineral products and animal fat are the major export goods of Indonesia, with the value reaching 47.59 billion U.S. dollars and 20.35 billion U.S. dollars in 2018, up 19.8 percent, and down 11.4 percent, respectively. The total exports of the two categories accounted for 37.7 percent of Indonesia's total exports. Besides, the export of mechanical and electrical products, and textile and raw materials was 14.72 billion U.S. dollars and 13.22 billion U.S. dollars respectively, up 2.7 percent and 5.4 percent respectively, and accounting for 8.2 percent and 7.3 percent of Indonesia's total exports. In 2018, Indonesia witnessed increase in most of imported goods. Among them, the import of mechanical and electrical products, mineral products, base metals and products was 48.41 billion U.S. dollars, 32.99 billion U.S. dollars, and 20.13 billion U.S. dollars respectively, up 21.9 percent, 23.2 percent, and 25.7 percent respectively. Imports of the three categories altogether accounted for 54 percent of Indonesia's total imports. It is worth noting that the import of chemical products and plastic and rubbers was 18.71 billion U.S. dollars and 11.5 billion U.S. dollars respectively, up 16.9 percent and 17.3 percent, and accounting for 10 percent and 6.1 percent of Indonesia's total imports, respectively.
According to Statistics Indonesia, in 2018, the goods trade between Indonesia and China reached 72.48 billion U.S. dollars, up 23.7 percent. Among them, Indonesia's exports to China were 27.13 billion U.S. dollars, up 18.9 percent and accounting for 15.1 percent of its total exports. Indonesia's imports from China goods were 45.35 billion U.S. dollars, up 26.8 percent and accounting for 24.1 percent of its total imports. The trade deficit between Indonesia and China was 18.22 billion U.S. dollars, up 40.6 percent.
Mineral products, animal fat as well as base metals and products, are Indonesia's three major exports to China, with the export value in 2018 reaching 10.79 billion U.S. dollars, 3.25 billion U.S. dollars and 3.19 billion U.S. dollars respectively, up 43.1 percent, down 0.1 percent and up 27.4 percent, and accounting for 39.8 percent, 12 percent and 11.8 percent of Indonesia's total exports to China, respectively. Indonesia's fourth and fifth largest type of goods exported to China are cellulose pulp and chemical products, with export value in 2018 reaching 2.5 billion U.S. dollars and 2.32 billion U.S. dollars respectively, up 18 percent and 21.8 percent. The exports of the two types altogether accounted for 17.8 percent of Indonesia's total exports to China.
Mechanical and electrical equipment imported by Indonesia from China reached 19.81 billion U.S. dollars in 2018, up 28.3 percent and accounting for 43.7 percent of Indonesia's total imports from China. The imports of base metals and products, chemical products, textile and raw materials, and plastic and rubber rank as the top 2, 3, 4, 5 products respectively in 2018, with import value reaching 5.71 billion U.S. dollars, 4.56 billion U.S. dollars, 4.08 billion U.S. dollars, and 2.12 billion U.S. dollars respectively, up 35.9 percent, 18.8 percent, 23.1 percent, and 30.5 percent, respectively. Imports of the four categories altogether accounted for 36.3 percent of Indonesia's total imports from China. In terms of the above-mentioned goods, Japan, the U.S., the ROK, Thailand, and other countries are the major competitors of China.
Table 3 Bilateral trade between China and Indonesia (2012-2018)
Year | Indonesia's total exports to China (USD100 mln) | Year-on-year growth of Indonesia's exports to China (percent) | Indonesia's total imports from China (USD100 mln) | Year-on-year growth of Indonesia's imports from China (percent) | Total goods trade between China and Indonesia (USD100 mln) |
2012 | 216.6 | 12.1% | 293.9 | 12.1% | 510.5 |
2013 | 226.0 | 4.4% | 298.5 | 1.6% | 524.5 |
2014 | 176.1 | -22.1% | 306.2 | 2.6% | 482.3 |
2015 | 150.5 | -14.6% | 294.1 | -4.0 % | 444.6 |
2016 | 167.9 | 11.6% | 308.0 | 22.7% | 475.9 |
2017 | 228.1 | 35.9% | 357.7 | 16.1% | 585.7 |
2018 | 271.3 | 18.9% | 453.5 | 24.1% | 724.8 |
Source: Ministry of Commerce of the People's Republic of China
Port of Jakarta handles 50 percent of transshipment cargo in Indonesia. The port has 24 major quay berths, a shoreline of 5,514 meters, with a maximum water depth of 11.5 meters. It is equipped with quay crane, gantry crane, floating crane, container crane, lorry-mounted crane, and grab loader. The floating crane has a maximum hoisting capacity of 200 tonnes, and the tugboat has a maximum power of 1,103kW. There are also 30 mooring buoys, capable of mooring ships of 15 thousand deadweight tonnes (DWT). The export processing zone of the port takes up 280 thousand square meters, and has built bonded warehouses since 1969.
Many home appliances, auto, and fiber products have streamed into Indonesian market from Japan, gradually driving up the container throughput of Indonesia. The major export goods of the port include rubber, tea, pepper, coffee, wood, zinc, quinine, oil and tobacco, and the main import goods of the port include machinery, steel, rice, medicine, home appliances, milk, and sugar. Foreign trade throughput of the port accounts for over 50 percent of Indonesia's import goods, with major trading partners including Japan, the U.S., Singapore, and other countries.
The port currently has four terminals, namely UTC1 (JICT), UTC2, UTC3, and NPCT1. The No. 1 terminal (UTC1) of Jakarta, officially the Jakarta International Container Terminal (JICT), is located in Tanjung Priok, Jakarta, and is the largest container port in Indonesia. It is co-founded and co-owned by Pelabuhan Indonesia II and Hutchison Port Holdings Limited. The port has been awarded at the 2011 Asian Freight, Logistics and Supply Chain (AFLAS) Awards for offering the best services and for its modern technologies. No. 2 terminal (UTC2) of Jakarta is an old terminal, consisting of terminal T300, T3 and T305. No. 3 terminal (UTC3) of Jakarta, officially the Koja Terminal, was co-developed by Pelabuhan Indonesia II and private companies in late 1990, since the original two terminals cannot meet Jakarta's demand for import and export handling. Currently, the Koja Terminal is managed by KOJA (Kota Jaya). It has an annual container handling capacity of 1 million TEUs, and is capable of mooring container ships of the fourth generation. Terminal NPCT1 is the newest international container terminal in Jakarta. In order to handle the ever-increasing freight volume in Jakarta, NPCT1 was co-developed by PT Pelindo II/IPC and joint ventures of Japan and Singapore. It can accommodate the operation of 15,000 TEUs of large container ships.

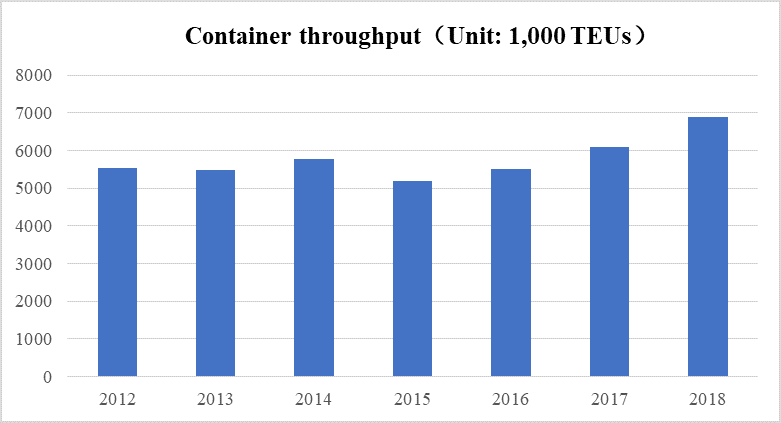
Fig.2 Container throughput of port of Jakarta (2012-2018)
Source: Lloyd's List
In 2018, Indonesia signed a memorandum of understanding with China to jointly promote the Belt and Road construction and build “Global Maritime Axis”. The co-development of the 21st Century Maritime Silk Road is an important foothold for China-Indonesia cooperation. In the Vision for Maritime Cooperation under the Belt and Road Initiative jointly released by the National Development and Reform Commission (NDRC) and State Oceanic Administration (SOA), it is proposed that efforts will be made to advance the development of the East Asian Ocean Cooperation Platform and the China-ASEAN Marine Cooperation Center, to promote the construction of marine economy development demonstration zones, and to create growth points for Blue Economy. The Vision has offered a new thinking for integrating the Belt and Road Initiative with national development strategies of Indonesia and other countries, while promoting marine economy and cultural exchanges at the same time.
Jakarta-Bandung High-speed Railway, for which the construction is well underway, is a flagship project at the first stage of development strategy integration between China and Indonesia. On May 16, 2018, the China-ASEAN Belt and Road Business Forum--The First E-Commerce Cooperation Dialogue was held in Jakarta. As said at the forum, China and Indonesia are embracing opportunities to intensify cooperation, and using cross-border e-commerce as a platform to shape the "Digital Silk Road" covering China and ASEAN. (Source: http://www.chinaports.com)
 A single purchase